Ask ChatGPT to compare GDP trends across ten countries and it will happily hand you a clean data table — or even a block of chart configuration code — in seconds. Turning that into something you can actually look at, a bar chart or a line graph, still means copying it into Excel, reformatting the columns, and fighting the chart wizard. That gap between "ChatGPT understood the data" and "I have a chart" is the exact workflow this guide fixes.
The manual workflow everyone hates
The usual routine looks like this: ask ChatGPT for a breakdown, copy the table it returns, paste it into Excel or Google Sheets, clean up misaligned columns, select the range, open the chart wizard, and pick a chart type. For a quick comparison you wanted in ten seconds, that's five minutes of formatting busywork — and if you tweak the question and ask ChatGPT again, you do the whole thing over.
Why ChatGPT can describe data but can't show you a chart
ChatGPT is a text model. It can write out numbers, describe a trend, or even generate the JSON/config code that a charting library would need to draw a graph — but the chat window itself has no chart renderer. When you ask for "a pie chart of these proportions," what you often get back is either a plain-text table or literal chart configuration code sitting in a code block, syntactically correct but visually useless until something turns it into an actual chart.
What "good" chart-from-chat should look like
A useful chart tool for ChatGPT answers should do three things well:
- Render in place — turn the chart code or data ChatGPT just gave you into a live, visible chart right where you're already reading, not in a separate app.
- Support the common chart types — bar, line, and pie at minimum, since those cover the vast majority of "compare these numbers" requests.
- Let you export what you built — download the chart as an image or grab the underlying data, so the five seconds you saved don't get lost when you close the tab.
The failure mode to watch for in this category
This is a genuinely small, underserved niche — there aren't many chart tools built specifically for ChatGPT's output, and the ones that exist are lightly reviewed. The one clear signal from early adopters of a similarly positioned chart extension is a bad first impression:
"Crashed on first attempt to make chart, and then couldn't try again without upgrading to the paid program." — 1-star review of a chart-from-AI extension
For a tool whose entire value proposition is "save time on your very first chart," a crash-then-paywall on attempt one is close to fatal. Whatever tool you pick, the first chart you generate should just work, for free, before you form any opinion about upgrading.
Step-by-step: from a ChatGPT answer to a live chart
ChatGPT Chart Maker works by watching for chart-describing content in a ChatGPT response and rendering it as an actual chart next to the conversation — no exporting the data anywhere else.
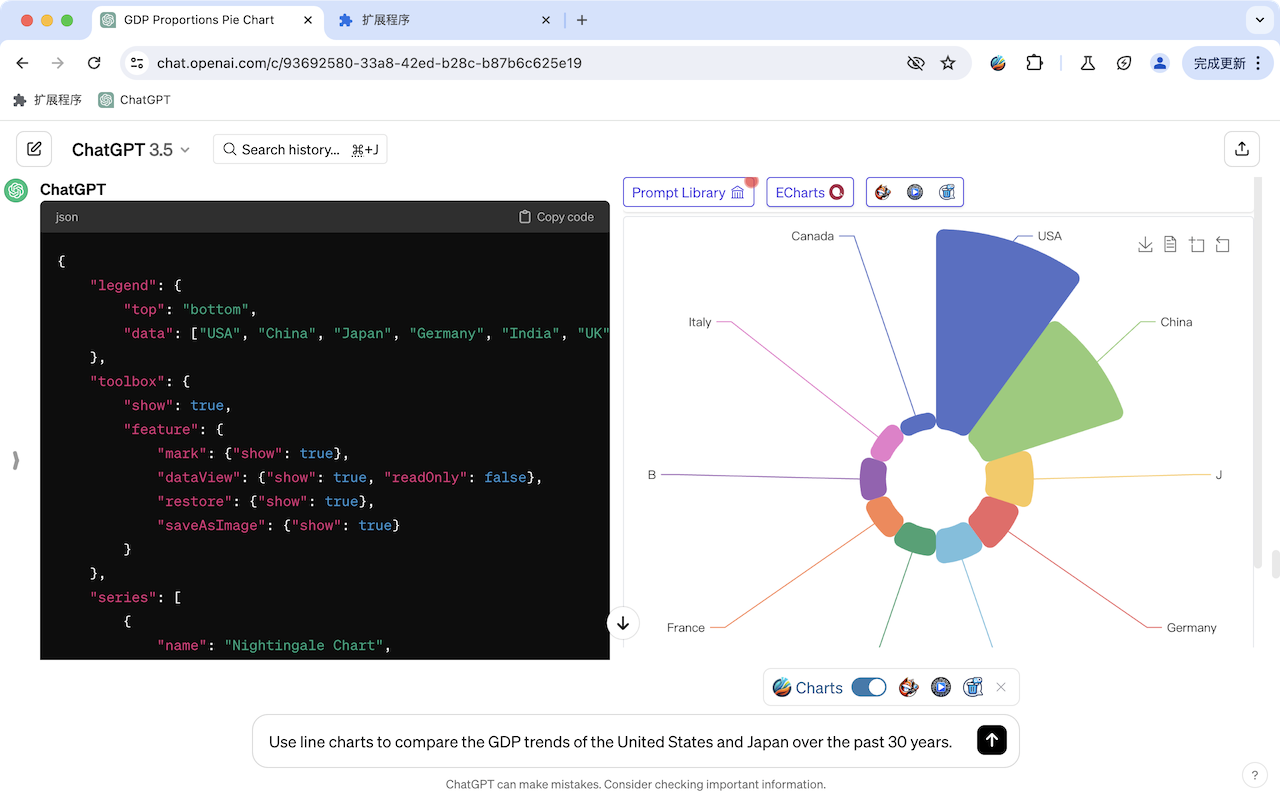
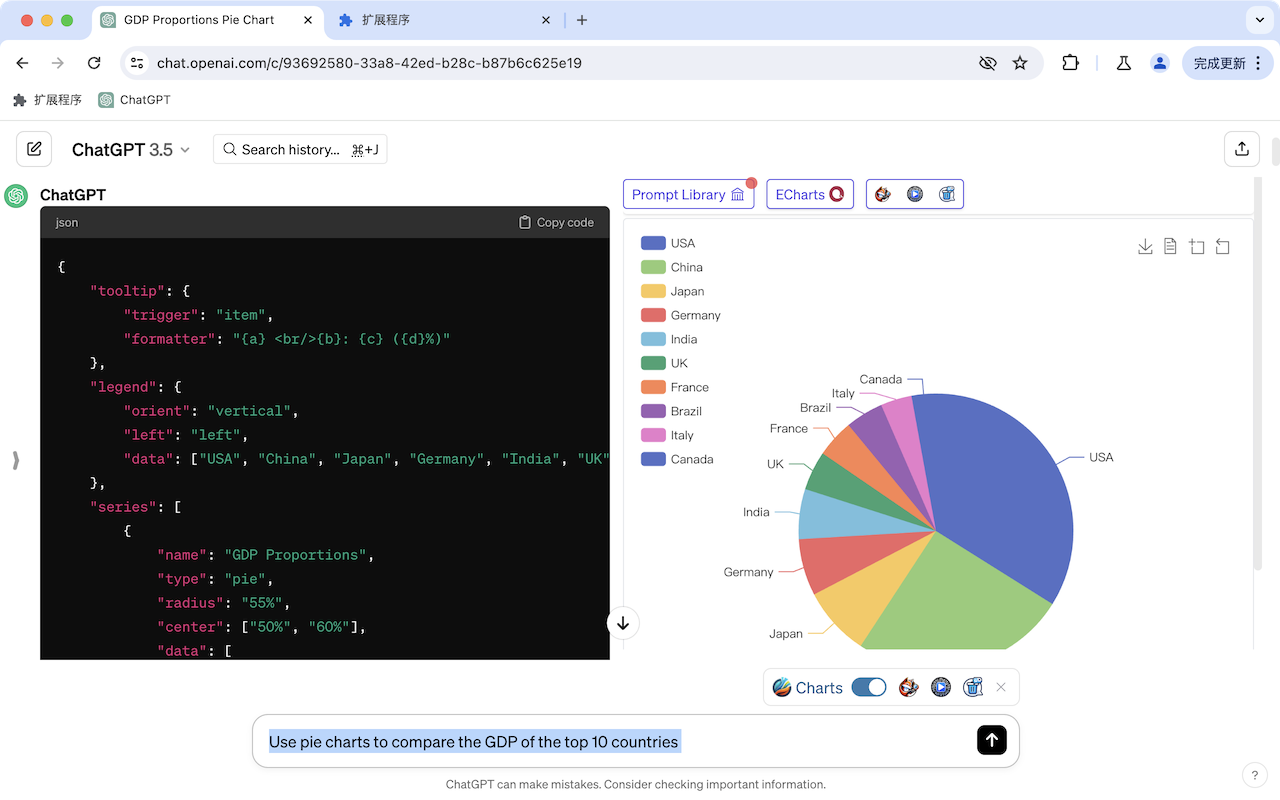
- Ask ChatGPT your data question directly, phrased as a chart request — for example, "Use pie charts to compare the GDP proportions of the top 10 countries."
- ChatGPT generates the underlying chart data/config in its response.
- The extension detects it and renders a live chart in a panel alongside the chat — in the example above, a labeled pie chart with every country's share, built from a single prompt.
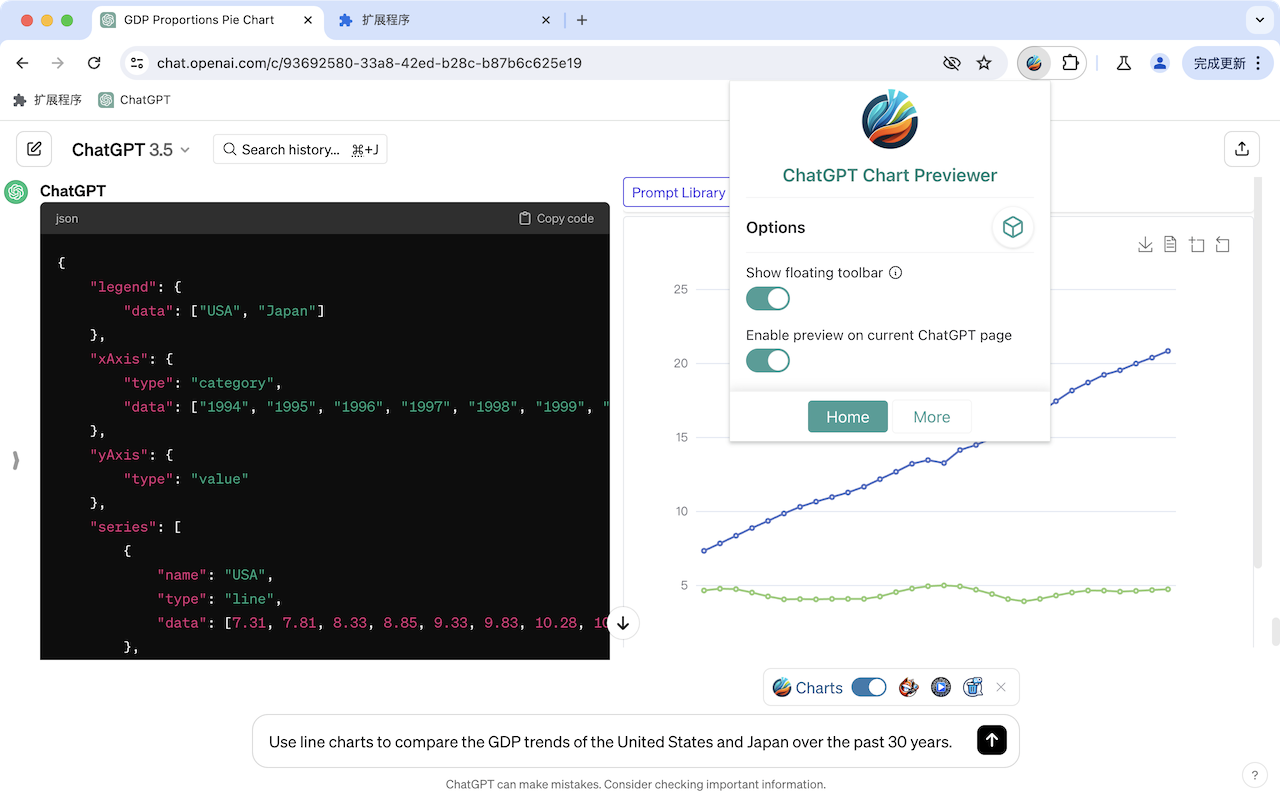
- Ask a follow-up in plain language — "use line charts to compare the GDP trends of the United States and Japan over the past 30 years" — and the preview updates to a new chart type without you touching a spreadsheet.
- Use the floating toolbar to toggle the preview on or off for the current page, or set it to activate automatically.
Manual Excel vs. one-click chart preview
| Step | Manual Excel workflow | Chart preview extension |
|---|---|---|
| Get the data | Copy ChatGPT's table | ChatGPT generates it in-chat |
| Reformat | Fix columns/rows by hand | Not needed |
| Build the chart | Chart wizard, pick type, style | Renders automatically from the response |
| Change chart type | Redo the wizard | Ask ChatGPT a new follow-up question |
| Export | Already in Excel | Download image / grab underlying data |
Use cases worth trying
- Business reports — ask ChatGPT to compare quarterly figures, revenue by region, or survey results, and preview the chart before it goes into a deck.
- Quick data checks — sanity-check a trend ("does this look right?") visually instead of squinting at a column of numbers.
- Presentations — generate a first-draft chart to talk through in a meeting, then rebuild it properly in your design tool once the shape of the data is confirmed.
- Homework and research — visualize a dataset you're discussing with ChatGPT without switching to a separate charting tool mid-conversation.
Worth noting: like any AI-generated visual, treat the first chart as a draft. Double-check labels, units, and totals before you drop it into something that matters — the tool is built to accelerate the "what would this look like as a chart" step, not to replace a final data-accuracy check.
The bottom line
The gap between "ChatGPT can describe my data" and "I have a chart" has mostly been closed by manual Excel work, and this is a niche few tools have addressed well — which is exactly why the one documented failure (crashing before a single free chart) stands out so clearly as what to avoid. If you ask ChatGPT for a chart more than once a week, previewing it live where you already asked the question beats copy-pasting into Excel every single time.